This article is one of our favourites from around the web. We've included an excerpt below but do go and read the original!
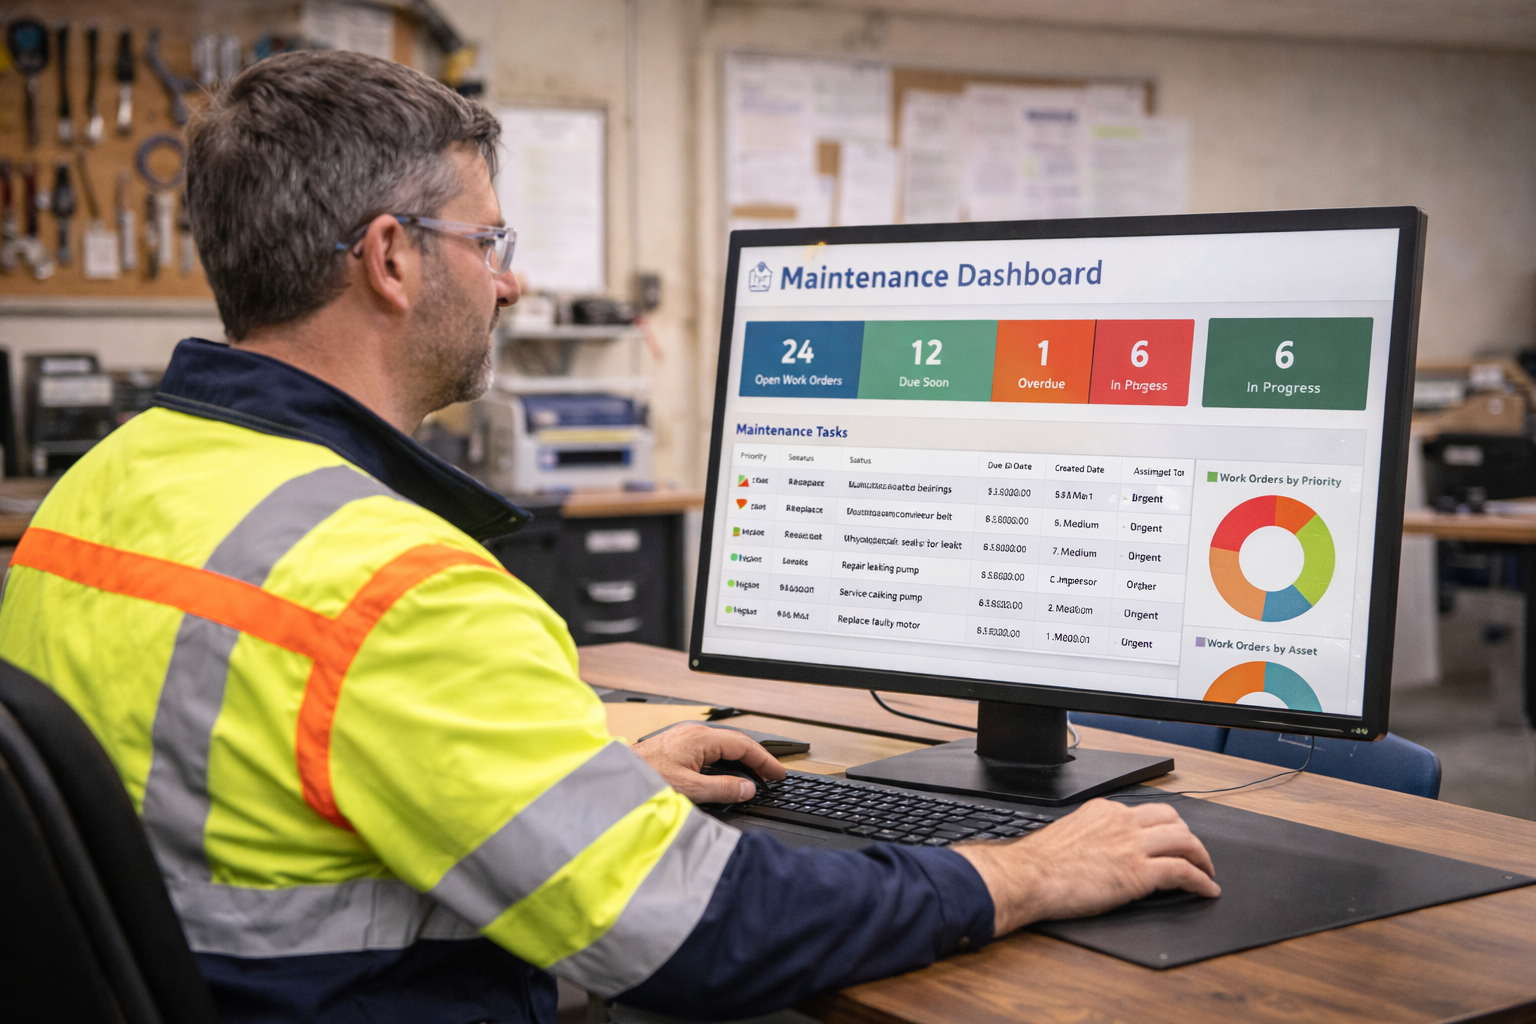
What gets measured gets managed - but only if you're measuring the right things. Many maintenance teams drown in data whilst starving for insights, tracking metrics that look impressive on dashboards but don't actually drive better decisions or outcomes. Effective KPIs transform maintenance from reactive firefighting into strategic asset management by revealing patterns, highlighting opportunities, and measuring progress toward meaningful goals.
Not all KPIs deserve your attention. Focus on metrics directly tied to your maintenance objectives: maximising equipment uptime, controlling costs, improving safety, and enhancing efficiency. Common high-value KPIs include overall equipment effectiveness (OEE), mean time between failures (MTBF), mean time to repair (MTTR), preventative maintenance compliance rates, maintenance cost as percentage of asset replacement value, and work order completion rates. These metrics provide actionable insights rather than vanity numbers that look good but drive no improvement.
One of the most telling metrics is how your maintenance time splits between planned preventative work and reactive emergency repairs. World-class operations maintain 80-90% planned work with only 10-20% reactive. If your ratio shows 50% or more reactive maintenance, you're stuck in firefighting mode that wastes resources and guarantees poor reliability. Tracking this metric focuses attention on shifting toward proactive approaches that actually prevent failures.
Equipment availability, the percentage of time assets are operational when needed, directly impacts productivity and revenue. Track both planned downtime for scheduled maintenance and unplanned downtime from unexpected failures. Distinguishing between these reveals whether your preventative programmes are effective or whether equipment keeps failing despite maintenance efforts. Set targets for maximum acceptable downtime and investigate whenever assets exceed thresholds.
How quickly does your team respond when equipment fails? How long does it take to complete repairs once started? These metrics identify bottlenecks in your maintenance process. Consistently slow response might indicate inadequate staffing, poor prioritisation, or communication breakdowns. Long repair times could point to parts availability issues, insufficient training, or overly complex procedures. Track these by equipment type and priority level to understand where improvements are needed most.
Total maintenance spending is less useful than cost per asset or cost as a percentage of asset value. These metrics reveal which equipment consumes disproportionate resources, helping you decide whether to increase preventative maintenance, modify operating conditions, or replace chronically problematic assets. Comparing costs across similar equipment at different locations also identifies best practices worth replicating or problem sites needing support.
The number of open work orders and their age indicates whether your maintenance capacity matches demand. Growing backlogs signal that work is arriving faster than your team can complete it, eventually leading to deferred maintenance and increased failures. Conversely, consistently empty backlogs might indicate you're overstaffed or that requesters have stopped bothering because work orders languish unfulfilled. The ideal is a manageable backlog of 1-2 weeks of planned work.
What percentage of maintenance tasks are completed successfully on the first attempt versus requiring return visits? Low first-time fix rates waste tremendous time and extend downtime. They often indicate inadequate diagnostics, insufficient parts inventory, incomplete work orders lacking necessary details, or technicians lacking proper skills or tools. Improving this metric directly enhances efficiency and asset availability.
The worst thing you can do with KPIs is weaponise them to blame individuals. Metrics should identify systemic issues and improvement opportunities, not create fear. When MTTR increases, don't punish technicians - investigate whether they lack resources, training, or support. When preventative maintenance compliance drops, explore whether schedules are unrealistic rather than assuming laziness. This approach builds trust and encourages honest reporting rather than gaming metrics.
Metrics lose impact when they're calculated monthly then ignored until next month. Hold regular review meetings where maintenance leadership and technicians discuss current performance, analyse trends, celebrate improvements, and identify actions to address concerning metrics. These discussions transform numbers on dashboards into shared understanding and collective commitment to improvement.
As your maintenance operation matures, the metrics that matter most may change. Early in a reliability journey, simply reducing reactive maintenance and improving preventative compliance might be primary goals. As these stabilise, you might shift focus toward optimising costs, improving energy efficiency, or enhancing sustainability. Regularly assess whether your KPIs still align with current priorities and adjust accordingly.
KPIs only drive improvement when insights lead to action. When metrics reveal problems, develop specific initiatives to address them: additional training, process changes, technology investments, or resource reallocation. Track whether these interventions actually improve the relevant KPIs. This closed-loop approach—measure, analyse, act, measure again—creates the continuous improvement cycles that separate high-performing maintenance operations from those perpetually struggling with the same issues.
HINDSITE's work management platform that ensures the right job gets done, every time. Connect with our team today.
What gets measured gets managed - but only if you're measuring the right things. Many maintenance teams drown in data whilst starving for insights, tracking metrics that look impressive on dashboards but don't actually drive better decisions or outcomes. Effective KPIs transform maintenance from reactive firefighting into strategic asset management by revealing patterns, highlighting opportunities, and measuring progress toward meaningful goals.
Not all KPIs deserve your attention. Focus on metrics directly tied to your maintenance objectives: maximising equipment uptime, controlling costs, improving safety, and enhancing efficiency. Common high-value KPIs include overall equipment effectiveness (OEE), mean time between failures (MTBF), mean time to repair (MTTR), preventative maintenance compliance rates, maintenance cost as percentage of asset replacement value, and work order completion rates. These metrics provide actionable insights rather than vanity numbers that look good but drive no improvement.
One of the most telling metrics is how your maintenance time splits between planned preventative work and reactive emergency repairs. World-class operations maintain 80-90% planned work with only 10-20% reactive. If your ratio shows 50% or more reactive maintenance, you're stuck in firefighting mode that wastes resources and guarantees poor reliability. Tracking this metric focuses attention on shifting toward proactive approaches that actually prevent failures.
Equipment availability, the percentage of time assets are operational when needed, directly impacts productivity and revenue. Track both planned downtime for scheduled maintenance and unplanned downtime from unexpected failures. Distinguishing between these reveals whether your preventative programmes are effective or whether equipment keeps failing despite maintenance efforts. Set targets for maximum acceptable downtime and investigate whenever assets exceed thresholds.
How quickly does your team respond when equipment fails? How long does it take to complete repairs once started? These metrics identify bottlenecks in your maintenance process. Consistently slow response might indicate inadequate staffing, poor prioritisation, or communication breakdowns. Long repair times could point to parts availability issues, insufficient training, or overly complex procedures. Track these by equipment type and priority level to understand where improvements are needed most.
Total maintenance spending is less useful than cost per asset or cost as a percentage of asset value. These metrics reveal which equipment consumes disproportionate resources, helping you decide whether to increase preventative maintenance, modify operating conditions, or replace chronically problematic assets. Comparing costs across similar equipment at different locations also identifies best practices worth replicating or problem sites needing support.
The number of open work orders and their age indicates whether your maintenance capacity matches demand. Growing backlogs signal that work is arriving faster than your team can complete it, eventually leading to deferred maintenance and increased failures. Conversely, consistently empty backlogs might indicate you're overstaffed or that requesters have stopped bothering because work orders languish unfulfilled. The ideal is a manageable backlog of 1-2 weeks of planned work.
What percentage of maintenance tasks are completed successfully on the first attempt versus requiring return visits? Low first-time fix rates waste tremendous time and extend downtime. They often indicate inadequate diagnostics, insufficient parts inventory, incomplete work orders lacking necessary details, or technicians lacking proper skills or tools. Improving this metric directly enhances efficiency and asset availability.
The worst thing you can do with KPIs is weaponise them to blame individuals. Metrics should identify systemic issues and improvement opportunities, not create fear. When MTTR increases, don't punish technicians - investigate whether they lack resources, training, or support. When preventative maintenance compliance drops, explore whether schedules are unrealistic rather than assuming laziness. This approach builds trust and encourages honest reporting rather than gaming metrics.
Metrics lose impact when they're calculated monthly then ignored until next month. Hold regular review meetings where maintenance leadership and technicians discuss current performance, analyse trends, celebrate improvements, and identify actions to address concerning metrics. These discussions transform numbers on dashboards into shared understanding and collective commitment to improvement.
As your maintenance operation matures, the metrics that matter most may change. Early in a reliability journey, simply reducing reactive maintenance and improving preventative compliance might be primary goals. As these stabilise, you might shift focus toward optimising costs, improving energy efficiency, or enhancing sustainability. Regularly assess whether your KPIs still align with current priorities and adjust accordingly.
KPIs only drive improvement when insights lead to action. When metrics reveal problems, develop specific initiatives to address them: additional training, process changes, technology investments, or resource reallocation. Track whether these interventions actually improve the relevant KPIs. This closed-loop approach—measure, analyse, act, measure again—creates the continuous improvement cycles that separate high-performing maintenance operations from those perpetually struggling with the same issues.


.png)