This article is one of our favourites from around the web. We've included an excerpt below but do go and read the original!
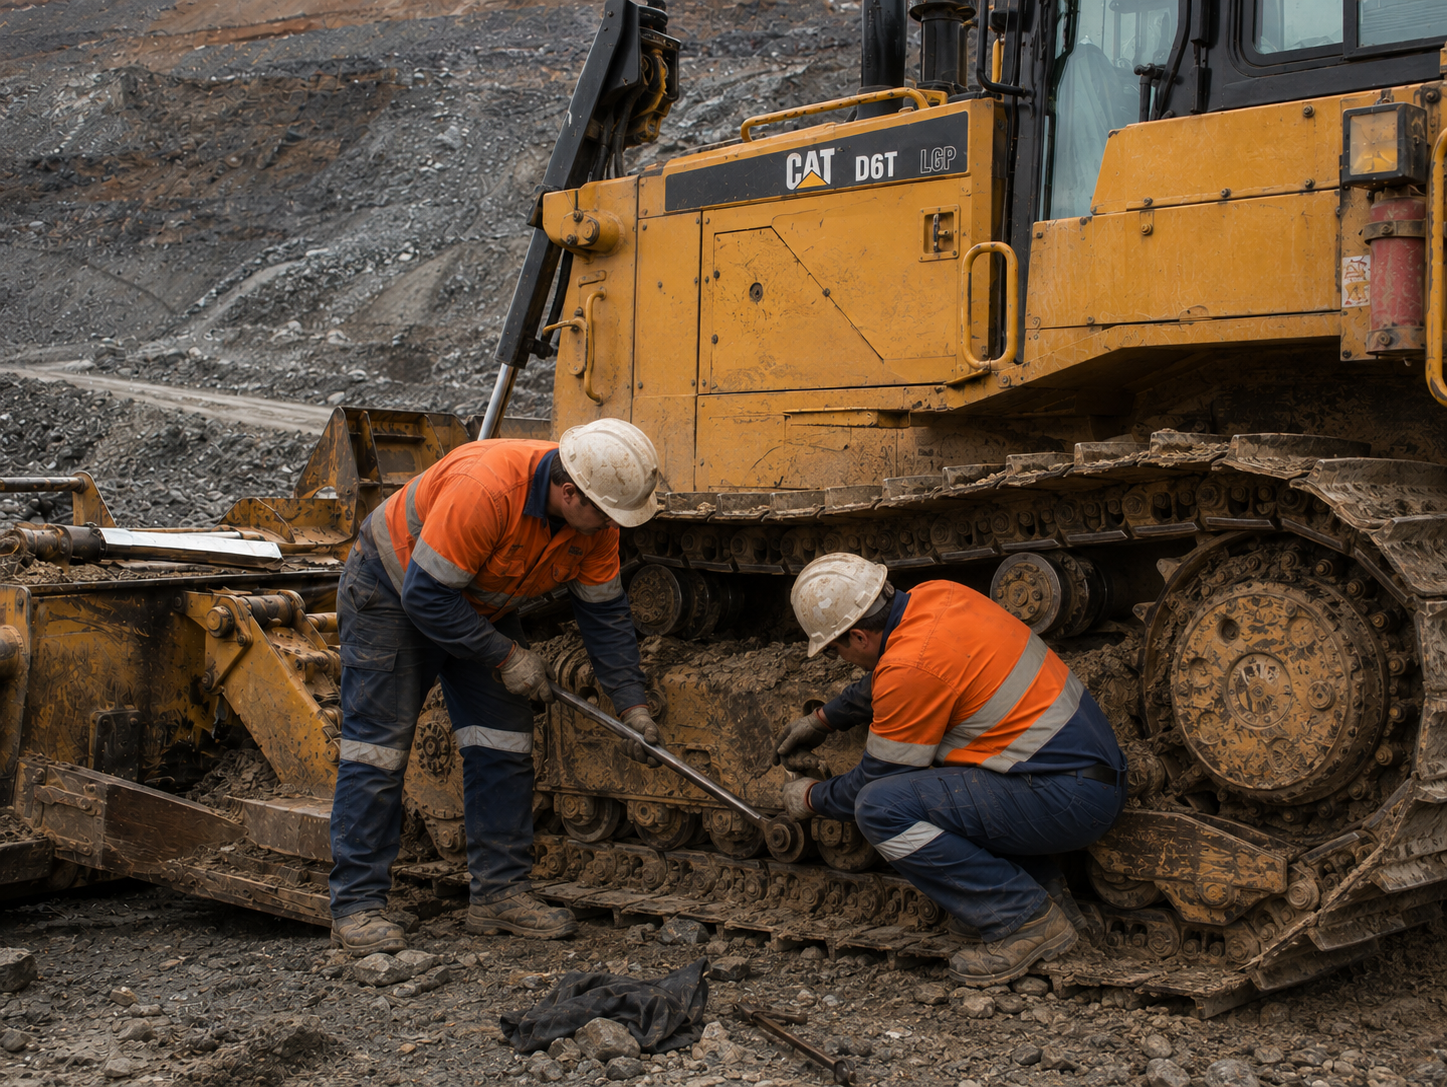
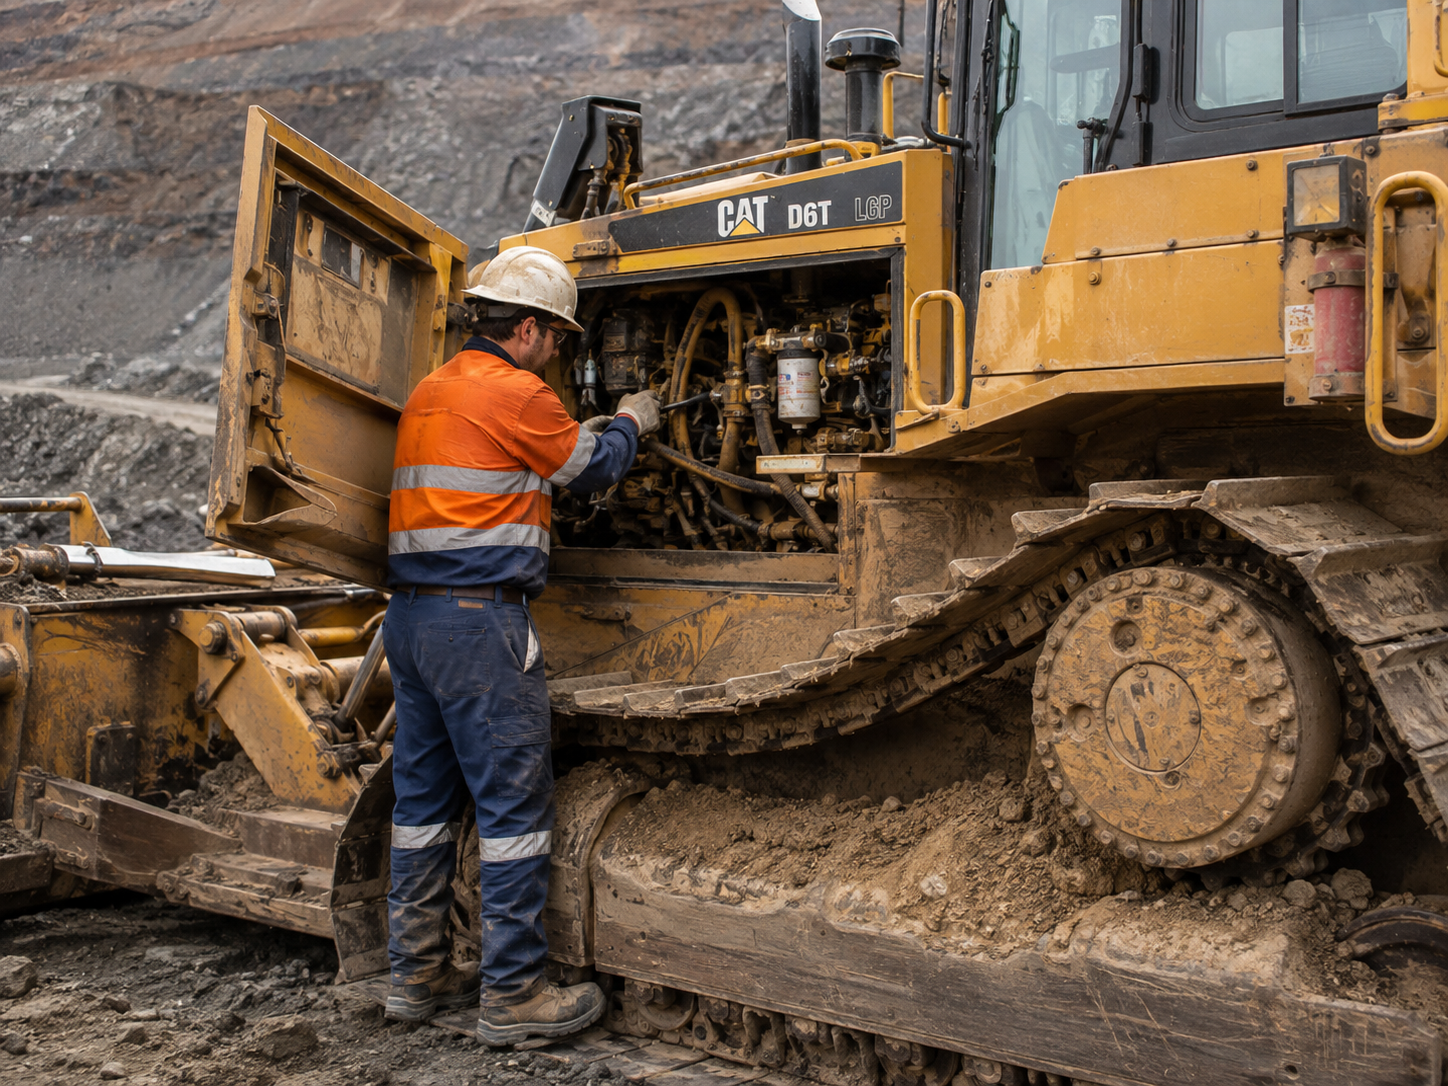
A repeat visit looks like a minor inconvenience on paper: one more job on the schedule, one more callout. In practice, it's one of the most expensive and under-measured problems in field service. The direct cost is obvious, another technician, another trip. The hidden costs, lost capacity, eroded customer trust, and compounding scheduling strain, are usually much larger, and much easier to miss.
Understanding the full cost of a repeat visit is the first step to justifying the investment needed to prevent them.
A repeat visit, sometimes called a callback, is any return trip required to resolve an issue that a technician was already dispatched to address, within a defined window, commonly 30 days. It's distinct from a new, unrelated issue on the same asset; a repeat visit specifically means the original problem wasn't fully fixed the first time.
Repeat visits are the direct inverse of first-time fix rate: if 100 jobs are completed and 18 require a follow-up visit, first-time fix rate is 82 percent, and the repeat visit rate is 18 percent. That 18 percent isn't just a number on a dashboard; it represents real cost showing up across the business in several different forms.
Labour and travel, doubled. The most obvious cost of a repeat visit is paying for a technician's time and travel a second time for work that should have been completed once. For jobs involving significant travel distance, this cost is magnified further.
Parts and materials. If the original visit used parts that didn't resolve the issue, or if new parts are needed for the follow-up, those costs add up on top of the original job.
Scheduling disruption. A repeat visit has to be slotted into an already full schedule, often on short notice if the customer is unhappy about the delay. This frequently means displacing or delaying other planned work, creating a ripple effect well beyond the original job.
Lost technician capacity. Every hour spent on a repeat visit is an hour not spent on new, revenue-generating work. At scale, a high repeat visit rate quietly reduces the effective capacity of the entire technician team, without ever showing up as an explicit "cost" on a P&L statement.
Customer trust. Customers judge service quality heavily on whether their problem actually got fixed, not on how quickly a technician showed up. A visible pattern of repeat visits, even if each individual job eventually gets resolved, erodes confidence and makes customers more likely to question invoices, delay payments, or look elsewhere for future work. The link between first-time fix rate and customer satisfaction is well documented: Salesforce has reported that the top 20 percent of organisations for customer satisfaction achieved an 88 percent first-time fix rate, compared with 63 percent among the next-best performers, underlining just how directly repeat visits and customer perception are linked.
Compounding scheduling pressure. Repeat visits don't just cost time on the day they happen; they distort future scheduling too. Dispatchers start padding schedules to absorb the risk of callbacks, which reduces overall utilisation across the team even on days when no repeat visits actually occur.
Diagnostic debt. If the root cause of a repeat visit isn't properly identified and documented, the same issue is more likely to resurface again later, sometimes with a different technician who has no visibility into what was already tried. This turns a single avoidable callback into a recurring pattern on that asset.
Warranty and liability exposure. For industrial equipment, an issue that isn't fully resolved can escalate into a larger failure before the next scheduled visit, potentially creating warranty disputes or safety and compliance exposure that far outweighs the cost of the original repeat visit itself.
The exact cost of a repeat visit varies by industry, but a useful way to estimate it for your own business is to add up: the fully loaded cost of a technician's time and travel for the follow-up visit, any additional parts required, and a conservative estimate of the opportunity cost of the technician's displaced capacity (what else they could have been doing with that time).
Multiplying that per-visit cost by your repeat visit rate across total job volume tends to produce a number significantly larger than most service leaders initially expect, which is exactly why reducing repeat visits is one of the highest-leverage areas to focus on.
Most repeat visits trace back to a small set of root causes: incomplete diagnostic information, missing parts, jobs rushed due to poor scheduling, or a technician without the right skill set for the complexity of the job. Diagnosing repeat visits by root cause, rather than treating them as a single undifferentiated problem, is what makes meaningful reduction possible.
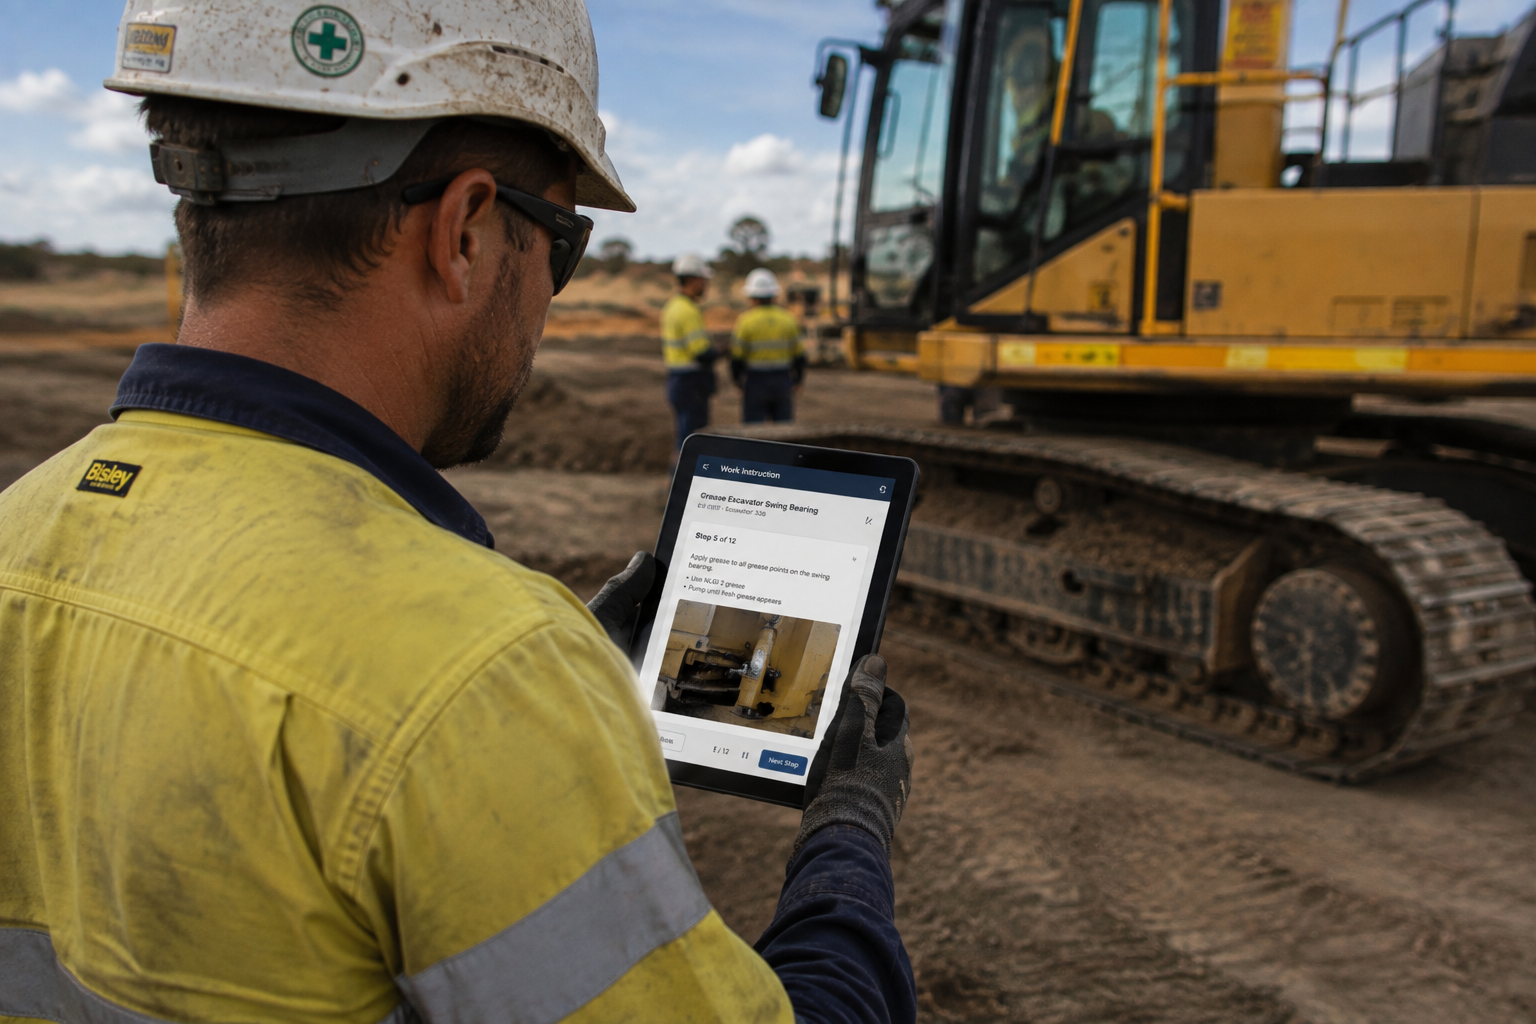
Full visibility into asset history is one of the most effective ways to address this. When a technician can see exactly what was tried on the previous visit, what parts were used, and what was ruled out, they're far less likely to repeat work that's already been done or miss something that was already flagged. Platforms like HINDSITE make this history available directly on a technician's mobile device before they arrive, closing one of the most common and costly gaps that leads to a second visit.
Unlike many operational improvements, the return on reducing repeat visits is unusually easy to calculate: fewer callbacks translate directly into recovered technician capacity, lower travel and parts costs, and improved customer trust, all without requiring any additional headcount.
Treating repeat visit rate as a core metric to track and actively manage, rather than an unavoidable cost of doing business, is one of the clearest ways to improve both margins and customer satisfaction at the same time.
HINDSITE's work management platform that ensures the right job gets done, every time. Connect with our team today.
A repeat visit looks like a minor inconvenience on paper: one more job on the schedule, one more callout. In practice, it's one of the most expensive and under-measured problems in field service. The direct cost is obvious, another technician, another trip. The hidden costs, lost capacity, eroded customer trust, and compounding scheduling strain, are usually much larger, and much easier to miss.
Understanding the full cost of a repeat visit is the first step to justifying the investment needed to prevent them.
A repeat visit, sometimes called a callback, is any return trip required to resolve an issue that a technician was already dispatched to address, within a defined window, commonly 30 days. It's distinct from a new, unrelated issue on the same asset; a repeat visit specifically means the original problem wasn't fully fixed the first time.
Repeat visits are the direct inverse of first-time fix rate: if 100 jobs are completed and 18 require a follow-up visit, first-time fix rate is 82 percent, and the repeat visit rate is 18 percent. That 18 percent isn't just a number on a dashboard; it represents real cost showing up across the business in several different forms.
Labour and travel, doubled. The most obvious cost of a repeat visit is paying for a technician's time and travel a second time for work that should have been completed once. For jobs involving significant travel distance, this cost is magnified further.
Parts and materials. If the original visit used parts that didn't resolve the issue, or if new parts are needed for the follow-up, those costs add up on top of the original job.
Scheduling disruption. A repeat visit has to be slotted into an already full schedule, often on short notice if the customer is unhappy about the delay. This frequently means displacing or delaying other planned work, creating a ripple effect well beyond the original job.
Lost technician capacity. Every hour spent on a repeat visit is an hour not spent on new, revenue-generating work. At scale, a high repeat visit rate quietly reduces the effective capacity of the entire technician team, without ever showing up as an explicit "cost" on a P&L statement.
Customer trust. Customers judge service quality heavily on whether their problem actually got fixed, not on how quickly a technician showed up. A visible pattern of repeat visits, even if each individual job eventually gets resolved, erodes confidence and makes customers more likely to question invoices, delay payments, or look elsewhere for future work. The link between first-time fix rate and customer satisfaction is well documented: Salesforce has reported that the top 20 percent of organisations for customer satisfaction achieved an 88 percent first-time fix rate, compared with 63 percent among the next-best performers, underlining just how directly repeat visits and customer perception are linked.
Compounding scheduling pressure. Repeat visits don't just cost time on the day they happen; they distort future scheduling too. Dispatchers start padding schedules to absorb the risk of callbacks, which reduces overall utilisation across the team even on days when no repeat visits actually occur.
Diagnostic debt. If the root cause of a repeat visit isn't properly identified and documented, the same issue is more likely to resurface again later, sometimes with a different technician who has no visibility into what was already tried. This turns a single avoidable callback into a recurring pattern on that asset.
Warranty and liability exposure. For industrial equipment, an issue that isn't fully resolved can escalate into a larger failure before the next scheduled visit, potentially creating warranty disputes or safety and compliance exposure that far outweighs the cost of the original repeat visit itself.
The exact cost of a repeat visit varies by industry, but a useful way to estimate it for your own business is to add up: the fully loaded cost of a technician's time and travel for the follow-up visit, any additional parts required, and a conservative estimate of the opportunity cost of the technician's displaced capacity (what else they could have been doing with that time).
Multiplying that per-visit cost by your repeat visit rate across total job volume tends to produce a number significantly larger than most service leaders initially expect, which is exactly why reducing repeat visits is one of the highest-leverage areas to focus on.
Most repeat visits trace back to a small set of root causes: incomplete diagnostic information, missing parts, jobs rushed due to poor scheduling, or a technician without the right skill set for the complexity of the job. Diagnosing repeat visits by root cause, rather than treating them as a single undifferentiated problem, is what makes meaningful reduction possible.
Full visibility into asset history is one of the most effective ways to address this. When a technician can see exactly what was tried on the previous visit, what parts were used, and what was ruled out, they're far less likely to repeat work that's already been done or miss something that was already flagged. Platforms like HINDSITE make this history available directly on a technician's mobile device before they arrive, closing one of the most common and costly gaps that leads to a second visit.
Unlike many operational improvements, the return on reducing repeat visits is unusually easy to calculate: fewer callbacks translate directly into recovered technician capacity, lower travel and parts costs, and improved customer trust, all without requiring any additional headcount.
Treating repeat visit rate as a core metric to track and actively manage, rather than an unavoidable cost of doing business, is one of the clearest ways to improve both margins and customer satisfaction at the same time.